Take a look at some of the most recent trends in the El Segundo real estate market. The chart below shows the past 15 months and the number of active MLS listings in El Segundo, pending home sales and closed sales each month. September was a great month with an impressive 20 closed home sales in El Segundo.
September Home Sales in El Segundo CA
What a month it was for real estate in El Segundo CA. September say 20 homes selling during the month, compared to only 6 sales in September 2019. The median price of the homes that sold was an impressive $1,420,000. Equally impressive was the short 25 days on the market before selling compared with 47 a year earlier.
View the current homes for sale in El Segundo CA.
September 2020 Property Sales and Home Prices
| Type | Address | Price | $ Per Foot | Bed/Bath | Sq Feet | Year | |
| CONDO | 770 W | Imperial AVE #71 | $547,000 | $544.28 | 2/2,0,0,0 | 1005/ | 1966 |
| CONDO/A | 818 | Main ST #101 | $729,000 | $518.49 | 2/2,0,0,0 | 1406/A | 1979/ASR |
| TWNHS/A | 1325 E | Grand AVE #D | $860,000 | $633.75 | 3/3,0,0,0 | 1357/A | 1989/ASR |
| TWNHS/A | 224 W | Imperial AVE | $902,000 | $601.33 | 3/2,0,1,0 | 1500/A | 2005/ASR |
| TWNHS/A | 1629 E | Palm AVE #8 | $922,200 | $574.58 | 3/2,0,1,0 | 1605/A | 1991/ASR |
| TWNHS/A | 594 E | Imperial AVE | $959,990 | $546.07 | 3/3,0,1,0 | 1758/B | 2018/BLD |
| TWNHS/A | 512 E | Imperial AVE | $989,990 | $563.13 | 3/3,0,1,0 | 1758/B | 2018/BLD |
| TWNHS | 1700 E | Mariposa AVE #4 | $1,075,000 | $632.35 | 3/2,0,1,0 | 1700/ | 2013 |
| TWNHS/A | 540 E | Imperial AVE | $1,105,000 | $561.20 | 3/3,0,1,0 | 1969/B | 2018/BLD |
| TWNHS/A | 360 | Richmond ST | $1,188,750 | $675.04 | 3/4,0,0,0 | 1761/A | 2000/ASR |
| SFR/D | 832 | Bungalow DR | $1,325,000 | $968.57 | 3/2,0,0,0 | 1368/A | 1943/ASR |
| SFR/D | 745 | Virginia ST | $1,470,000 | $893.07 | 3/2,0,1,0 | 1646/A | 1924/ASR |
| SFR/D | 422 E | Maple AVE | $1,659,000 | $614.67 | 5/3,0,0,0 | 2699/A | 1975/ASR |
| SFR/D | 1543 E | Palm | $1,900,000 | $894.96 | 3/2,0,1,0 | 2123/A | 2016/BLD |
| SFR/D | 720 W | Pine AVE | $1,950,000 | $958.23 | 3/2,0,1,0 | 2035/D | 1962/APP |
| SFR/D | 811 | California ST | $1,990,000 | $700.70 | 4/4,0,1,0 | 2840/A | 1997/ASR |
| SFR/D | 825 | Center ST | $2,055,000 | $772.56 | 4/3,0,0,0 | 2660/B | 1943/ASR |
| SFR/D | 539 | Loma Vista | $2,240,000 | $734.91 | 4/2,2,0,0 | 3048/A | 2011/ASR |
| SFR/D | 610 W | Pine AVE | $2,240,000 | $635.82 | 5/3,0,1,0 | 3523/AP | 1956/ASR |
| SFR/D | 710 W | Sycamore AVE | $2,285,000 | $668.72 | 4/4,0,0,0 | 3417/A | 2015/ASR |
What’s Happening in El Segundo Real Estate? Big Uptick in Pending Home Sales
Here’s the latest on the El Segundo real estate market. The story of the month was the big uptick in the number of homes in escrow during August which should make for an impressive September.
View the current homes for sale in El Segundo CA
Community Spotlight – Pacific Sands Condos in El Segundo
If you’re looking for a home in El Segundo but seem to be priced out of this charming coastal community, the condo complex known as
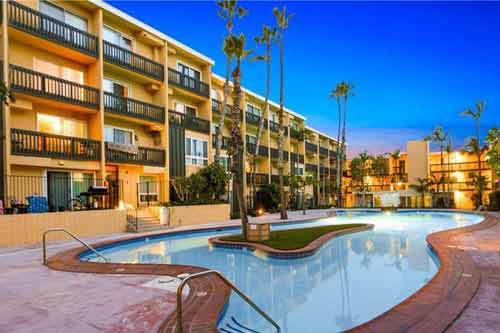
Pacific Sands is often the most affordable location in all of El Segundo.
Located at 770 W Imperial Ave, Pacific Sands is located in the northwest corner of El Segundo and offers just a short drive, walk or bike to the beach. Built in 1966, most condos have been extensively remodeled while a few are still in fairly original condition. The condos are primarily 2 bedroom there are a few one bedrooms as well. Square footage generally ranges from about 700 square feet to a tad over 1,110 sq feet*. As of this writing HOA dues are around $435 a month.
In the center of the complex is a beautiful saltwater swimming pool, communty gym, jacuzzi, sauna and clubhouse/recreational room. Some of the landscaping and waterfall/bridge features give it a definite resort like feel. The community does allow pets but has restrictions.
Current Pacific Sands Condos For Sale
View more information on the homes for sale and real estate in El Segundo CA
2020 El Segundo Real Estate Trends and Statistics
As with all of the South Bay (and the world) the real estate market in El Segundo was dominated by concerns over the pandemic. April was a historically slow month with only 3 total home sales compared with 10 the prior April. Things seem to be picking up however with pending sales on the rise significantly. March saw 3 pending sales, April saw 4, 11 in May and 17 in June which is the highes number since April of 2019. Inventory of active listings is still somewhat on the high side but dropping as the market picks up a bit. The median home prices and price per foot for homes in El Segundo in Q2 were impressive.
What’s the Latest – El Segundo Real Estate Stats for the 2nd Quarter
The story of El Segundo in Q2 of 2020 was much like the rest of the world…..with home sales slowing dramatically due to the concerns and real world impacts of the coronavirus. Home sales were very slow especially in April and May. June picked back up which is great news and hopefully the market can get back to pre-covid numbers. April-June saw only 22 total home sales in El Segundo compared with 49 in the same months a year earlier. The good news is that it was still a very solid market in terms of numbers….especially for sellers. The median home price was an impressive $1,251,000 and the average days on market was a very short 23. For a bit of historical perspective see our recent post on the number of home sales over the past 15 months in El Segundo.
View all of the homes currently for sale in El Segundo

- « Previous Page
- 1
- …
- 9
- 10
- 11
- 12
- 13
- …
- 15
- Next Page »