As with all of the South Bay (and the world) the real estate market in El Segundo was dominated by concerns over the pandemic. April was a historically slow month with only 3 total home sales compared with 10 the prior April. Things seem to be picking up however with pending sales on the rise significantly. March saw 3 pending sales, April saw 4, 11 in May and 17 in June which is the highes number since April of 2019. Inventory of active listings is still somewhat on the high side but dropping as the market picks up a bit. The median home prices and price per foot for homes in El Segundo in Q2 were impressive.
El Segundo Home of the Week – 321 Lomita Street
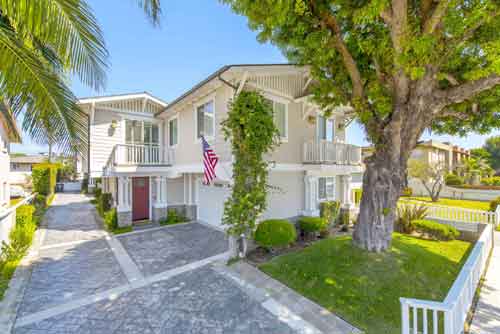
The luxury home market in El Segundo CA seems to grow more prevalent as the construction boom has gotten rid of many of the smaller  post war beach bungalows and replaced them with large high end homes (in our opinion there’s some good, some bad to this slow transformation). One of the homes built just a few years ago was 321 Lomita Street. As new consstruction the home sold for $2,300,000 in April of 2018. It’s for sale once again. Listed at $2,600,000, the “coastal farm house” inspired home is a beautiful 5 bedroom home on Lomita Street with architecture the listing agent is calling “coastal farm house” offering a little over 3,000 square feet on a 5,700+ fool lot.
The home last sold for $2,300,000 on 04/02/18
PRICE: $2,600,000
BEDS: 5
BATH: 4 1/2
SQFT: 3,029*
PRICE PER SQFT: $858.37
LOT SIZE: 5,723 SQ FEET
GARAGE: 2 CAR SIDE BY SIDE
YEAR: 2018
Information on 321 Lomita Street El Segundo W Mariposa, El Segundo
Listing Courtesy of Amie Schneider – Compass
El Segundo Real Estate Snapshot
Welcome to our real estate recap for April 2020. It’s just a quick overview of the El Segundo real estate market and what seems to be the trends and indicates where the market is likely to go.
View the current homes for sale in El Segundo California
It was pretty clear that the impacts of the coronavirus was definitely felt in April. There were only 3 closed home sales compared with 10 the year earlier. That’s the bad news…..the good news is that other numbers were solid. The median sales price for the month was $993,000 and days on market was only 7 which is pretty incredible. Those numbers should be taken with a grain of salt as 3 homes simply aren’t enough to read too much into. For more on real estate trends and statistics view our detailed market information.
See also the homes that sold in April 2020
El Segundo Alternative – Torrance CA Real Estate
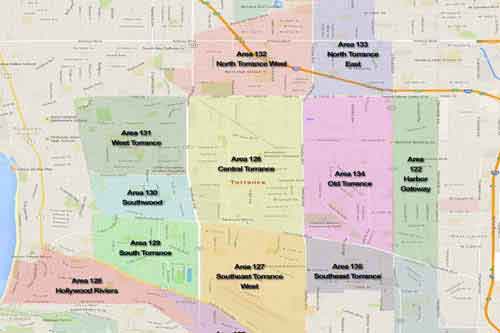
If you’re looking for a home in El Segundo, but either priced out or just want to explore other areas of the south Bay……welcome to real estate and homes for sale in Torrance CA. Housing in the area and homes can range from small studio condos in the low $300,000s to the biggest sale in the South Bay on the bluffs of the Hollywood Riviera. You can also search Torrance homes for sale by price, or search our Torrance CA MLS interactive map.
Click on any link below to see more information on the neighborhoods or Torrance and search homes for sale in those areas.
 |
 |
 |
 |
 |
 |
 |
 |
 |
 |
 |
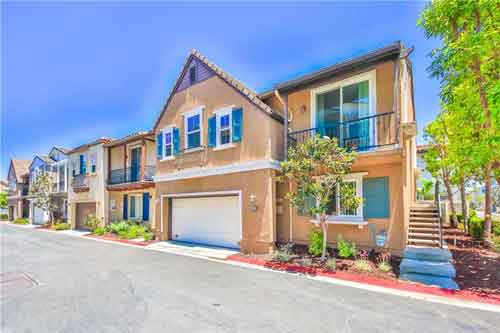 |
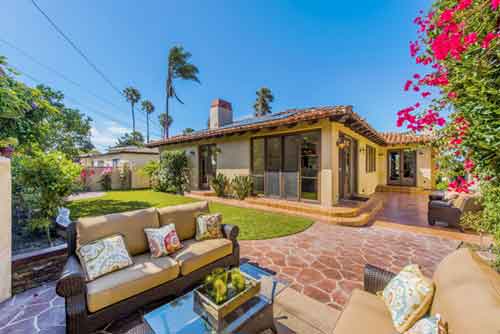 |
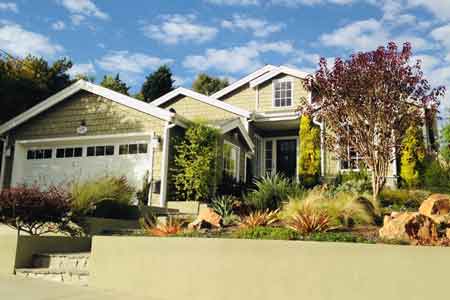 |
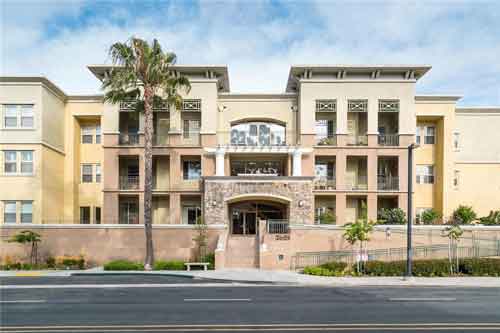 |
 |
 |
 |
Want an easier way? Tell us a bit about your home search and we’ll email you automatic new listing alerts the moment a home comes on the market. This FREE customized email matches your home search. It’s the easiest way to know about new Torrance California homes for sale first.
Current homes for sale in Torrance California
Click any MLS number above for details and photos of the home.
Market Update – El Segundo Home Sales and Prices for November 2019
Homes in Waypointe, Pacific Landing and Pacific Sands led the way for a very busy month in El Segundo real estate. Given that El Segundo averages around ten to eleven home sales a month, the 17 sold homes was a big number, especially when considering the usual slower market in late fall. November is not traditionally an overly active months for real estate in El Segundo.
The median “list” price for the month was $1,499,000 with a median “sold” price of $1,330,000 which is fairly unusual for the South Bay in November. It may be an indication that prices are softening or may just be a blip on the rader. See the 2019 El Segundo real estate trends below. Average days on market for the month was 54 and median days on market was 30.
The lowest priced sale of the month was a 2 bedroom condo at 770 W Imperial Ave known as Pacific Sands. While this is a great starter complex, Pacific Sands is generally the least expensive housing option in El Segundo. The highest priced property sale of the month was a very large single family home located at 414 W Oak. Other notable sales were 510 E Imperial Ave, 516 E Imperial Avenue, 552 E Imperial Avenue which are all in the new townhome construction community of Waypointe and 926 Fairing Place which is in the new construction single family community of Pacific Landing.
View the active homes for sale in El Segundo California
November 2019 Home Sales and Home Prices in El Segundo.
| MLS | Type | Address | Price | $ per Foot | Bed/Bath | Sq Feet | Year | Sold Date | |
| 19517428 | CONDO | 770 W | Imperial AVE 68 | $515,000 | $512 | 2/1,0,1,0 | 1005/A | 1966 | 11/14/2019 |
| IN19228928 | CONDO/A | 770 W | Imperial AVE #89 | $545,000 | $575 | 2/2,0,0,0 | 948/A | 1966/ASR | 11/26/2019 |
| SB19175483 | CONDO/A | 818 | Main ST #202 | $732,000 | $521 | 2/2,0,0,0 | 1406/A | 1979/ASR | 11/26/2019 |
| SW19110379 | TWNHS/A | 510 E | Imperial AVE | $1,000,000 | $508 | 3/3,0,1,0 | 1969/B | 2018/BLD | 11/1/2019 |
| SW19101433 | TWNHS/A | 516 E | Imperial AVE | $1,015,000 | $577 | 3/3,0,1,0 | 1758/B | 2018/BLD | 11/29/2019 |
| SB19221255 | TWNHS/A | 121 W | Palm AVE #3 | $1,050,000 | $626 | 3/3,0,1,0 | 1678/A | 1990/ASR | 11/15/2019 |
| SW19131717 | CONDO/A | 552 E | Imperial AVE 314 | $1,094,924 | $623 | 3/3,0,1,0 | 1758/B | 2019/BLD | 11/29/2019 |
| SB19244352 | SFR/D | 422 | Maryland ST | $1,225,000 | $929 | 3/1,1,0,0 | 1318/P | 1947/PUB | 11/28/2019 |
| SB19189819 | SFR/D | 704 | Penn ST | $1,330,000 | $801 | 3/2,0,1,0 | 1661/A | 1941/ASR | 11/26/2019 |
| SB19221319 | SFR/D | 845 | McCarthy CT | $1,585,000 | $868 | 4/3,0,0,0 | 1825/A | 1952/ASR | 11/1/2019 |
| SW19045535 | SFR/D | 926 | Fairing PL | $1,665,000 | $560 | 4/3,0,1,0 | 2975/B | 2018/BLD | 11/18/2019 |
| SB19222745 | SFR/D | 1124 E | Acacia AVE | $1,845,000 | $766 | 4/3,0,1,0 | 2410/D | 1949/ASR | 11/7/2019 |
| SB19149734 | SFR/D | 925 | Sheldon ST | $1,950,000 | $701 | 4/3,0,1,0 | 2781/B | 2019/BLD | 11/26/2019 |
| SB19150418 | SFR/D | 929 | Sheldon ST | $1,975,000 | $710 | 4/3,0,1,0 | 2781/B | 2019/BLD | 11/15/2019 |
| SB19083854 | SFR/D | 506 | Sheldon ST | $2,060,000 | $762 | 4/4,0,0,0 | 2705/S | 1952/ASR | 11/15/2019 |
| SB19160605 | SFR/D | 712 W | Pine AVE | $2,150,000 | $755 | 4/4,2,0,0 | 2846/T | 2009/SLR | 11/22/2019 |
| SB19217162 | SFR/D | 414 W | Oak AVE | $2,510,000 | $669 | 6/4,0,0,0 | 3750/B | 2019/BLD | 11/13/2019 |
See all of the real estate trends and statistics in El Segundo
Real Estate Trends – September 2019 Home Sales and Prices in El Segundo
The numbers are in for September 2019 for home sales in El Segundo and the South Bay. El Segundo saw a slow down in home sales for the month of September with only 6 closed sales with a median price of $1,279,000. The lowest price of the month was a 2 bedroom condo in the Pacific Sands complex at 770 W Imperial Ave which sold at $525,000. Another notable sale was at 211 Walnut which closed at $1,000,000 after almost 4 months on the market. To see more than just September and to get a sense of the real estate market over the past year, see the El Segundo real estate trends and statistics page.
View the current homes for sale in El Segundo CA
| MLS | Type | Address | Address | Sold Price | $ Per Foot | Bed/Bath | Sq Feet | Year | Sold Date |
| SB19148522 | SFR/D | 1209 E | Maple AVE | $1,641,500 | $615.49 | 4/1,2,1,0 | 2667/A | 1965/ASR | 9/5/2019 |
| SB19221385 | SFR/D | 618 | Penn ST | $1,788,000 | $846.99 | 3/2,0,1,0 | 2111/A | 1920/ASR | 9/16/2019 |
| SR19071328 | SFR/D | 211 W | Walnut AVE | $1,000,000 | $775.19 | 2/1,0,0,1 | 1290/D | 1952/PUB | 9/20/2019 |
| OC19182425 | SFR/D | 224 W | Acacia AVE | $1,083,065 | $785.97 | 3/2,0,0,0 | 1378/A | 1955/ASR | 9/20/2019 |
| SB19114447 | CONDO/A | 770 W | Imperial AVE #24 | $525,000 | $551.47 | 2/1,1,0,0 | 952/A | 1966/APP | 9/23/2019 |
| SB19159836 | SFR/D | 808 | Penn ST | $1,475,000 | $655.56 | 3/2,0,1,0 | 2250/A | 1979/ASR | 9/24/2019 |
- « Previous Page
- 1
- …
- 7
- 8
- 9
- 10
- Next Page »